Showing posts with label Amibroker. Show all posts

Tuesday, November 13, 2012

Technical Analysis Of DSE General Index on 12/11/2012

Technical Analysis Of DSE General Index on 12/11/2012

Today Dsegen has lost 29 points.The lowest point of index was 4200 and closed @ 4223. Index recovered 23 points from the lowest value of the day.This behaviour of index at suport zone seems positive.We had these levels (4224 and 42214) before and got uptrend. Moreover, volume is lower than yesterday. This means supply shrank a bit.At this point retailers are going to be empty handed gradually, and demand must increase.So,logically the index should reverse from this point. But if this downtrend continues further with big volume, Index may hit as low as 4039. In short, Index may reverse from this point or may fall as low as 4039. Thanks everyone

Monday, January 23, 2012

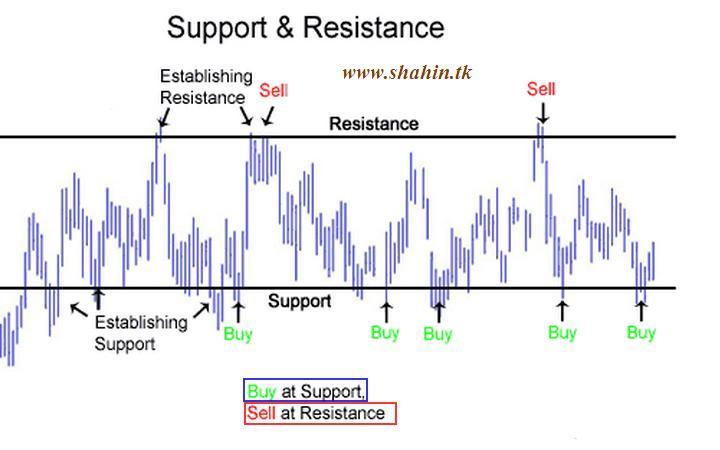
Support And Resistance in Technical Analysis


Support

A support level is a price level where the price tends to find support as it is going down. This means the price is more likely to "bounce" off this level rather than break through it. However, once the price has passed this level, by an amount exceeding some noise, it is likely to continue dropping until it finds another support level.
Resistance

A resistance level is the opposite of a support level. It is where the price tends to find resistance as it is going up. This means the price is more likely to "bounce" off this level rather than break through it. However, once the price has passed this level, by an amount exceeding some noise, it is likely that it will continue rising until it finds another resistance level.

Thursday, December 1, 2011

EOD Data Of 01/12/2011


Dear Friends,
Download today's EOD data (Stockbangladesh Format). Just click here to download it in .rar format.Please uncheck "log errors'' and " automatically add new symbols" while uploading csv into your amibroker.

CSV Of DSE


Dear visirors,
For last 3 days or so we missed .csv files from stockbangladesh.com . Here is the link you can download the csv files from. Just click on Download, you will get csv files of 29 /11/2011 and 30/11/2011. Important note : Please uncheck "log errors" and "automatically add new symbols" while uploading data into your amibroker. Also note that it will work as the csv you get from stockbangladesh.com

Sunday, November 6, 2011

Bullish And Bearish Volume in Stock Trading

How do we understand the health of a Market ? By Money Flow , by price and last but not the least VOLUME ! Yes, Volume is the second best indicator after PRICE itself. Here we have discussed about BULLISH and BEARISH volume . Interested Technical Analysts are requested to click on the image to enlarge it.

Friday, October 21, 2011

Importance Of Volume In Stock Trading


Importance of Volume

Why Volume? Volume is the second most valuable data after the price itself.
Large volume signifies that there is large number of market participants involved, including financial institutions. The last ones bring the highest turnover to the market, and if they are trading, it means the interest to the price at certain point and/or to the trend overall is high. Small volume tells that there are very little participants in the market, neither buyers no sellers have any significant interest in the price. In addition, no financial institutions will be involved, thus a market is going to be moved only by individual traders and so the move will be weak.

Volume and Trend

Volume helps to learn about the health of a trend.
An uptrend is strong and healthy if Volume increases as price moves with the trend and decreases when price goes counter trend (correction periods).
When price is going up and volume is decreasing, it tells traders that a trend is unlikely to continue. Price may still attempt to increase at a slower pace, but once sellers get the grip on it (which will be signified by an increase in volume on a down candle), the price will fall.

A downtrend is strong and healthy if volume increases as price moves lower and decreases when it begins retracing upwards.
When price is falling and volume is decreasing, the downtrend is unlikely to continue. Price will either continue to decrease, but at a slower pace or start to rise.
 
Design by Free WordPress Themes | Bloggerized by Lasantha - Premium Blogger Themes | Best Buy Coupons